PixiJS Devtools: Debugging Made Easy
PixiJS Devtools is an unofficial Chrome extension that provides a seamless debugging experience for games and apps written with PixiJS. Developed by Bob Fanger, this free tool is a must-have for PixiJS developers.
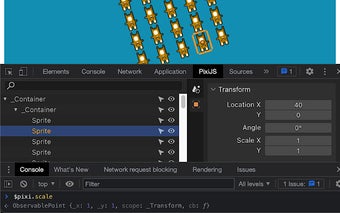
With PixiJS Devtools, you can easily debug your PixiJS projects by accessing a range of useful features. The extension allows you to view the scene graph, giving you a clear visual representation of the hierarchy of objects in your game or app. This makes it easier to understand the structure of your project and identify any potential issues.
In addition to viewing the scene graph, PixiJS Devtools also allows you to view and edit properties of objects in real-time. This enables you to make quick adjustments and see the immediate impact on your project.
One handy feature of PixiJS Devtools is the ability to double-click on a node in the outliner to console.log it. This makes it convenient to log specific nodes and analyze their properties and behavior.
To further enhance the debugging process, PixiJS Devtools outlines the active node in the viewport. This visual indicator helps you identify the currently active node, making it easier to focus on specific elements of your project.
Another useful feature is the availability of the active node in the developer console as `$pixi`. This allows you to access and manipulate the active node directly from the console, providing a seamless workflow for debugging.
Finally, PixiJS Devtools offers the ability to activate a node by right-clicking in the viewport. This simplifies the process of selecting and interacting with nodes, making debugging more efficient.
Overall, PixiJS Devtools is a powerful tool for PixiJS developers, providing essential features for debugging games and apps. With its intuitive interface and range of useful functionalities, this Chrome extension is a valuable addition to any PixiJS developer's toolkit.